Little Eagle
Hieraaetus morphnoides
ABR description
The following is extracted from the Annual Bird Report for the twelve months to June 2017.
Uncommon, breeding resident
Irregularly observed across the region, and over the suburbs. Declared vulnerable in NSW and the ACT.
General: Once again, a surprising number of records (162) (including 2 WOO) for a vulnerable species, but the reporting rate of 1.1% is 55% below the 30YA of 2.5%. Range 1-4 birds, average 1.1, median 1, with max 4/7 Oct Goulburn Wetlands GrZ01 (AnF1). Recorded fairly evenly throughout the year, and from 41 widespread mainly northerly grid cells. Unsurprisingly JWNR again accounted for a large proportion of the records (42%). 3 breeding records: di/20 Sep JWNR (MiP1); on/29 Oct Strathnairn (CuR1); and dy/5 Jan LGeo (LeM1). A further Canberra record of a successful breeding event in Campbell Park (see Olsen 2017) did not reach our databases. We note that this may be partial information.as a joint research project between the ACT Government, the University of Canberra, CSIRO and Ginninderry Joint Venture has only made available selected findings. The project did report the GPS tracking of a male from the Strathnairn pair to Daly Waters in the Northern Territory from 9 Mar, as it migrated between its breeding and wintering territories, returning to the ACT on 13 August.
GBS: 12 records, from 5 urban sites – Bonner, Narrabundah, Ainslie, Campbell and Curtin – and one rural – Carwoola. Common in none. Range 1-2 birds. The reporting rate of 0.5% was slightly below the long-term average of 0.6%. Half of the records came in summer and two each in the other seasons.

Abundance
Abundance is the average number of birds of that species per survey. Where the species was observed (presence recorded) but the number of birds seen was not recorded, this is treated as a count of zero.
Abundance by year
This chart shows the abundance of Little Eagle between 1982 and 2017. 
Abundance by month
This chart shows the monthly abundance of Little Eagle. The blue lines show the abundance for the twelve months to June 2017 and the bars show the average abundance for the period 1982 to 2017. 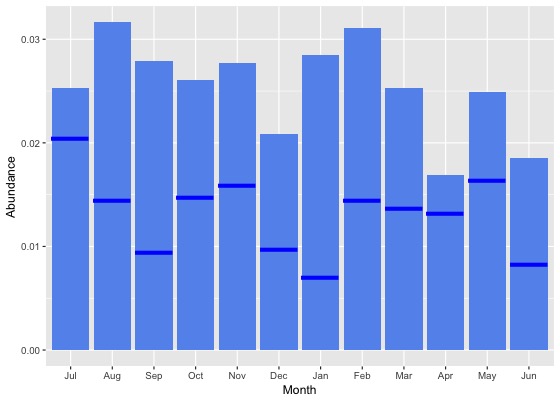
Abundance by season
This chart shows the seasonal abundance of Little Eagle. The blue lines show the seasonal abundance for the twelve months to June 2017 and the bars show the average seasonal abundance for the period 1982 to 2017. 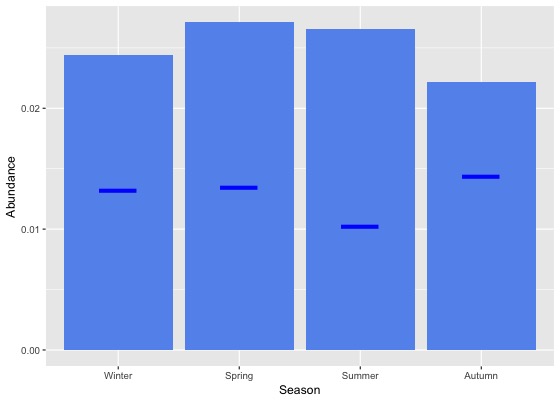
Abundance data
| Month | Season | ||||||||||||||||||
|---|---|---|---|---|---|---|---|---|---|---|---|---|---|---|---|---|---|---|---|
| Period | Jul | Aug | Sep | Oct | Nov | Dec | Jan | Feb | Mar | Apr | May | Jun | Winter | Spring | Summer | Autumn | All | ||
| All years | |||||||||||||||||||
| All | 0.0 | 0.0 | 0.0 | 0.0 | 0.0 | 0.0 | 0.0 | 0.0 | 0.0 | 0.0 | 0.0 | 0.0 | 0.0 | 0.0 | 0.0 | 0.0 | 0.0 | ||
| Previous years | |||||||||||||||||||
| All previous years | 0.0 | 0.0 | 0.0 | 0.0 | 0.0 | 0.0 | 0.0 | 0.0 | 0.0 | 0.0 | 0.0 | 0.0 | 0.0 | 0.0 | 0.0 | 0.0 | 0.0 | ||
| Previous 30 years | 0.0 | 0.0 | 0.0 | 0.0 | 0.0 | 0.0 | 0.0 | 0.0 | 0.0 | 0.0 | 0.0 | 0.0 | 0.0 | 0.0 | 0.0 | 0.0 | 0.0 | ||
| Previous 20 years | 0.0 | 0.0 | 0.0 | 0.0 | 0.0 | 0.0 | 0.0 | 0.0 | 0.0 | 0.0 | 0.0 | 0.0 | 0.0 | 0.0 | 0.0 | 0.0 | 0.0 | ||
| 10 year groups | |||||||||||||||||||
| [2007,2017) | 0.0 | 0.0 | 0.0 | 0.0 | 0.0 | 0.0 | 0.0 | 0.0 | 0.0 | 0.0 | 0.0 | 0.0 | 0.0 | 0.0 | 0.0 | 0.0 | 0.0 | ||
| [1997,2007) | 0.0 | 0.0 | 0.0 | 0.0 | 0.0 | 0.0 | 0.0 | 0.0 | 0.0 | 0.0 | 0.0 | 0.0 | 0.0 | 0.0 | 0.0 | 0.0 | 0.0 | ||
| [1987,1997) | 0.0 | 0.1 | 0.1 | 0.1 | 0.0 | 0.0 | 0.1 | 0.1 | 0.1 | 0.0 | 0.0 | 0.0 | 0.0 | 0.1 | 0.1 | 0.0 | 0.1 | ||
| 5 year groups | |||||||||||||||||||
| [2012,2017) | 0.0 | 0.0 | 0.0 | 0.0 | 0.0 | 0.0 | 0.0 | 0.0 | 0.0 | 0.0 | 0.0 | 0.0 | 0.0 | 0.0 | 0.0 | 0.0 | 0.0 | ||
| [2007,2012) | 0.0 | 0.1 | 0.0 | 0.0 | 0.0 | 0.0 | 0.1 | 0.1 | 0.0 | 0.0 | 0.0 | 0.0 | 0.0 | 0.0 | 0.0 | 0.0 | 0.0 | ||
| [2002,2007) | 0.0 | 0.0 | 0.0 | 0.0 | 0.0 | 0.0 | 0.0 | 0.0 | 0.0 | 0.0 | 0.0 | 0.0 | 0.0 | 0.0 | 0.0 | 0.0 | 0.0 | ||
| [1997,2002) | 0.0 | 0.0 | 0.0 | 0.0 | 0.0 | 0.0 | 0.0 | 0.0 | 0.0 | 0.0 | 0.0 | 0.0 | 0.0 | 0.0 | 0.0 | 0.0 | 0.0 | ||
| [1992,1997) | 0.0 | 0.0 | 0.0 | 0.1 | 0.0 | 0.0 | 0.0 | 0.1 | 0.1 | 0.0 | 0.0 | 0.0 | 0.0 | 0.0 | 0.1 | 0.0 | 0.0 | ||
| [1987,1992) | 0.0 | 0.1 | 0.1 | 0.1 | 0.0 | 0.0 | 0.1 | 0.1 | 0.1 | 0.0 | 0.0 | 0.0 | 0.0 | 0.1 | 0.1 | 0.0 | 0.1 | ||
| Year | |||||||||||||||||||
| 2017 | 0.0 | 0.0 | 0.0 | 0.0 | 0.0 | 0.0 | 0.0 | 0.0 | 0.0 | 0.0 | 0.0 | 0.0 | 0.0 | 0.0 | 0.0 | 0.0 | 0.0 | ||
| 2016 | 0.0 | 0.0 | 0.0 | 0.0 | 0.0 | 0.0 | 0.0 | 0.0 | 0.0 | 0.0 | 0.0 | 0.0 | 0.0 | 0.0 | 0.0 | 0.0 | 0.0 | ||
| 2015 | 0.0 | 0.0 | 0.0 | 0.0 | 0.0 | 0.0 | 0.0 | 0.0 | 0.0 | 0.0 | 0.0 | 0.0 | 0.0 | 0.0 | 0.0 | 0.0 | 0.0 | ||
| 2014 | 0.0 | 0.0 | 0.0 | 0.0 | 0.0 | 0.0 | 0.0 | 0.0 | 0.0 | 0.0 | 0.0 | 0.0 | 0.0 | 0.0 | 0.0 | 0.0 | 0.0 | ||
| 2013 | 0.1 | 0.0 | 0.0 | 0.0 | 0.1 | 0.0 | 0.0 | 0.0 | 0.0 | 0.0 | 0.0 | 0.0 | 0.0 | 0.0 | 0.0 | 0.0 | 0.0 | ||
| 2012 | 0.0 | 0.0 | 0.0 | 0.0 | 0.1 | 0.0 | 0.0 | 0.0 | 0.0 | 0.0 | 0.0 | 0.1 | 0.0 | 0.0 | 0.0 | 0.0 | 0.0 | ||
| 2011 | 0.1 | 0.1 | 0.1 | 0.0 | 0.0 | 0.0 | 0.0 | 0.0 | 0.0 | 0.0 | 0.0 | 0.0 | 0.0 | 0.0 | 0.0 | 0.0 | 0.0 | ||
| 2010 | 0.1 | 0.0 | 0.1 | 0.0 | 0.0 | 0.0 | 0.1 | 0.0 | 0.0 | 0.0 | 0.0 | 0.0 | 0.0 | 0.0 | 0.0 | 0.0 | 0.0 | ||
| 2009 | 0.0 | 0.1 | 0.0 | 0.0 | 0.0 | 0.1 | 0.0 | 0.1 | 0.0 | 0.0 | 0.1 | 0.0 | 0.0 | 0.0 | 0.1 | 0.0 | 0.0 | ||
| 2008 | 0.0 | 0.1 | 0.0 | 0.0 | 0.0 | 0.0 | 0.1 | 0.1 | 0.0 | 0.0 | 0.0 | 0.0 | 0.0 | 0.0 | 0.1 | 0.0 | 0.0 | ||
| 2007 | 0.1 | 0.0 | 0.0 | 0.0 | 0.0 | 0.0 | 0.1 | 0.1 | 0.0 | 0.0 | 0.0 | 0.0 | 0.0 | 0.0 | 0.1 | 0.0 | 0.0 | ||
| 2006 | 0.0 | 0.0 | 0.0 | 0.0 | 0.0 | 0.0 | 0.0 | 0.0 | 0.1 | 0.0 | 0.0 | 0.0 | 0.0 | 0.0 | 0.0 | 0.0 | 0.0 | ||
| 2005 | 0.1 | 0.0 | 0.0 | 0.0 | 0.0 | 0.0 | 0.0 | 0.0 | 0.0 | 0.0 | 0.0 | 0.0 | 0.0 | 0.0 | 0.0 | 0.0 | 0.0 | ||
| 2004 | 0.0 | 0.0 | 0.0 | 0.0 | 0.0 | 0.0 | 0.0 | 0.0 | 0.0 | 0.0 | 0.0 | 0.0 | 0.0 | 0.0 | 0.0 | 0.0 | 0.0 | ||
| 2003 | 0.0 | 0.0 | 0.0 | 0.0 | 0.0 | 0.0 | 0.0 | 0.0 | 0.0 | 0.0 | 0.0 | 0.0 | 0.0 | 0.0 | 0.0 | 0.0 | 0.0 | ||
| 2002 | 0.0 | 0.0 | 0.0 | 0.0 | 0.0 | 0.0 | 0.0 | 0.0 | 0.0 | 0.0 | 0.0 | 0.0 | 0.0 | 0.0 | 0.0 | 0.0 | 0.0 | ||
| 2001 | 0.0 | 0.0 | 0.0 | 0.0 | 0.0 | 0.0 | 0.0 | 0.0 | 0.0 | 0.0 | 0.0 | 0.0 | 0.0 | 0.0 | 0.0 | 0.0 | 0.0 | ||
| 2000 | 0.0 | 0.0 | 0.0 | 0.0 | 0.0 | 0.0 | 0.0 | 0.0 | 0.0 | 0.0 | 0.0 | 0.0 | 0.0 | 0.0 | 0.0 | 0.0 | 0.0 | ||
| 1999 | 0.0 | 0.0 | 0.0 | 0.0 | 0.0 | 0.0 | 0.0 | 0.0 | 0.0 | 0.0 | 0.0 | 0.0 | 0.0 | 0.0 | 0.0 | 0.0 | 0.0 | ||
| 1998 | 0.0 | 0.0 | 0.0 | 0.0 | 0.0 | 0.0 | 0.0 | 0.0 | 0.0 | 0.0 | 0.0 | 0.0 | 0.0 | 0.0 | 0.0 | 0.0 | 0.0 | ||
| 1997 | 0.0 | 0.0 | 0.0 | 0.0 | 0.0 | 0.0 | 0.0 | 0.1 | 0.0 | 0.0 | 0.0 | 0.0 | 0.0 | 0.0 | 0.0 | 0.0 | 0.0 | ||
| 1996 | 0.1 | 0.0 | 0.0 | 0.1 | 0.1 | 0.0 | 0.0 | 0.1 | 0.1 | 0.0 | 0.0 | 0.0 | 0.0 | 0.1 | 0.0 | 0.0 | 0.0 | ||
| 1995 | 0.0 | 0.0 | 0.1 | 0.0 | 0.1 | 0.0 | 0.1 | 0.1 | 0.1 | 0.0 | 0.0 | 0.0 | 0.0 | 0.0 | 0.1 | 0.1 | 0.0 | ||
| 1994 | 0.0 | 0.1 | 0.1 | 0.0 | 0.0 | 0.0 | 0.0 | 0.1 | 0.0 | 0.0 | 0.0 | 0.0 | 0.1 | 0.0 | 0.1 | 0.0 | 0.0 | ||
| 1993 | 0.1 | 0.0 | 0.0 | 0.0 | 0.0 | 0.1 | 0.0 | 0.1 | 0.0 | 0.0 | 0.1 | 0.0 | 0.0 | 0.0 | 0.1 | 0.0 | 0.0 | ||
| 1992 | 0.0 | 0.0 | 0.0 | 0.1 | 0.1 | 0.0 | 0.0 | 0.2 | 0.0 | 0.1 | 0.0 | 0.0 | 0.0 | 0.1 | 0.1 | 0.0 | 0.0 | ||
| 1991 | 0.0 | 0.0 | 0.1 | 0.1 | 0.0 | 0.1 | 0.1 | 0.1 | 0.0 | 0.0 | 0.0 | 0.0 | 0.0 | 0.0 | 0.1 | 0.0 | 0.0 | ||
| 1990 | 0.0 | 0.1 | 0.0 | 0.0 | 0.1 | 0.1 | 0.1 | 0.1 | 0.0 | 0.1 | 0.0 | 0.1 | 0.1 | 0.0 | 0.1 | 0.0 | 0.1 | ||
| 1989 | 0.0 | 0.1 | 0.1 | 0.1 | 0.0 | 0.0 | 0.1 | 0.1 | 0.1 | 0.0 | 0.0 | 0.0 | 0.1 | 0.1 | 0.1 | 0.0 | 0.1 | ||
| 1988 | 0.1 | 0.1 | 0.1 | 0.1 | 0.1 | 0.0 | 0.1 | 0.1 | 0.1 | 0.1 | 0.0 | 0.0 | 0.1 | 0.1 | 0.1 | 0.1 | 0.1 | ||
| 1987 | 0.1 | 0.0 | 0.1 | 0.1 | 0.0 | 0.0 | 0.1 | 0.1 | 0.0 | 0.0 | 0.0 | 0.0 | 0.0 | 0.1 | 0.1 | 0.0 | 0.0 | ||
| 1986 | 0.0 | 0.1 | 0.1 | 0.0 | 0.1 | 0.0 | 0.2 | 0.1 | 0.1 | 0.1 | 0.0 | 0.1 | 0.1 | 0.0 | 0.1 | 0.1 | 0.1 | ||
| 1985 | 0.0 | 0.0 | 0.0 | 0.0 | 0.0 | 0.0 | 0.1 | 0.0 | 0.1 | 0.1 | 0.0 | 0.1 | 0.0 | 0.0 | 0.0 | 0.0 | 0.0 | ||
| 1984 | 0.0 | 0.0 | 0.0 | 0.0 | 0.0 | 0.0 | 0.0 | 0.0 | 0.0 | 0.0 | 0.0 | 0.0 | 0.0 | 0.0 | 0.0 | 0.0 | 0.0 | ||
| 1983 | 0.0 | 0.0 | 0.0 | 0.0 | 0.0 | 0.0 | 0.0 | 0.0 | 0.0 | - | 0.0 | 0.0 | 0.0 | 0.0 | 0.0 | 0.0 | 0.0 | ||
| 1982 | - | 0.0 | - | 0.0 | 0.0 | 0.0 | - | 0.0 | - | 0.1 | - | 0.0 | 0.0 | 0.0 | 0.0 | 0.1 | 0.0 | ||
Reporting rates
Reporting rate is the proportion of all surveys in which the species was present.
Reporting rate by year
This chart shows the reporting rate of Little Eagle each year between 1982 and 2017. 
Reporting rate by month
This chart shows the reporting rate by month of Little Eagle. The blue lines show the reporting rate for the twelve months to June 2017 and the bars show the average reporting rate for the period 1982 to 2017. 
Reporting rate by season
This chart shows the seasonal reporting rate of Little Eagle. The blue lines show the seasonal reporting rate for the twelve months to June 2017 and the bars show the average seasonal reporting rate for the period 1982 to 2017. 
Reporting rate data
| Month | Season | ||||||||||||||||||
|---|---|---|---|---|---|---|---|---|---|---|---|---|---|---|---|---|---|---|---|
| Period | Jul | Aug | Sep | Oct | Nov | Dec | Jan | Feb | Mar | Apr | May | Jun | Winter | Spring | Summer | Autumn | All | ||
| All years | |||||||||||||||||||
| All | 2.4 | 3.0 | 2.5 | 2.4 | 2.6 | 1.9 | 2.6 | 2.9 | 2.3 | 1.6 | 2.4 | 1.7 | 2.3 | 2.5 | 2.4 | 2.1 | 2.3 | ||
| Previous years | |||||||||||||||||||
| All previous years | 2.4 | 3.4 | 2.8 | 2.6 | 2.8 | 2.1 | 2.9 | 3.3 | 2.5 | 1.6 | 2.6 | 1.8 | 2.5 | 2.7 | 2.7 | 2.2 | 2.5 | ||
| Previous 30 years | 2.5 | 3.4 | 2.8 | 2.6 | 2.8 | 2.1 | 2.9 | 3.3 | 2.5 | 1.6 | 2.7 | 1.8 | 2.4 | 2.7 | 2.7 | 2.2 | 2.5 | ||
| Previous 20 years | 2.2 | 2.7 | 2.2 | 2.1 | 2.2 | 1.7 | 2.5 | 2.4 | 2.1 | 1.2 | 2.6 | 1.6 | 2.1 | 2.2 | 2.2 | 1.9 | 2.1 | ||
| 10 year groups | |||||||||||||||||||
| [2007,2017) | 2.3 | 3.0 | 2.6 | 2.2 | 2.7 | 2.0 | 2.8 | 2.5 | 1.9 | 1.3 | 2.8 | 1.9 | 2.4 | 2.4 | 2.5 | 1.9 | 2.3 | ||
| [1997,2007) | 1.9 | 2.0 | 1.5 | 1.6 | 1.4 | 1.2 | 1.5 | 2.3 | 2.5 | 1.1 | 2.1 | 0.8 | 1.5 | 1.5 | 1.6 | 1.9 | 1.6 | ||
| [1987,1997) | 3.3 | 5.3 | 5.7 | 6.0 | 4.5 | 4.2 | 5.1 | 7.4 | 5.0 | 3.6 | 2.9 | 2.8 | 3.9 | 5.4 | 5.5 | 3.8 | 4.7 | ||
| 5 year groups | |||||||||||||||||||
| [2012,2017) | 2.1 | 2.5 | 2.4 | 2.1 | 2.9 | 1.7 | 2.4 | 1.9 | 1.7 | 1.3 | 2.5 | 2.1 | 2.2 | 2.4 | 2.1 | 1.8 | 2.1 | ||
| [2007,2012) | 3.2 | 4.8 | 2.9 | 2.4 | 2.1 | 2.7 | 4.3 | 4.6 | 2.2 | 1.3 | 3.8 | 1.6 | 2.7 | 2.5 | 3.7 | 2.2 | 2.7 | ||
| [2002,2007) | 2.5 | 2.3 | 1.6 | 1.6 | 1.1 | 1.0 | 1.8 | 2.6 | 3.1 | 1.6 | 3.5 | 1.3 | 1.9 | 1.5 | 1.6 | 2.7 | 1.9 | ||
| [1997,2002) | 1.0 | 1.7 | 1.4 | 1.6 | 1.7 | 1.4 | 1.1 | 2.0 | 1.7 | 0.4 | 0.4 | 0.1 | 0.8 | 1.5 | 1.5 | 0.9 | 1.2 | ||
| [1992,1997) | 2.5 | 3.0 | 4.1 | 4.5 | 3.7 | 3.5 | 2.8 | 7.9 | 4.5 | 3.2 | 2.4 | 2.3 | 2.6 | 4.1 | 4.5 | 3.5 | 3.6 | ||
| [1987,1992) | 3.7 | 6.5 | 6.5 | 6.8 | 4.9 | 4.5 | 6.3 | 7.3 | 5.3 | 3.8 | 3.1 | 3.1 | 4.5 | 6.0 | 6.0 | 4.0 | 5.2 | ||
| Year | |||||||||||||||||||
| 2017 | 2.0 | 1.1 | 0.9 | 1.2 | 1.4 | 0.9 | 0.5 | 1.4 | 1.1 | 1.2 | 1.6 | 0.8 | 1.2 | 1.2 | 0.9 | 1.3 | 1.1 | ||
| 2016 | 0.9 | 1.0 | 2.6 | 1.9 | 2.0 | 1.6 | 2.1 | 1.8 | 2.0 | 1.3 | 2.0 | 2.2 | 1.4 | 2.2 | 1.9 | 1.7 | 1.8 | ||
| 2015 | 2.3 | 4.0 | 2.2 | 2.5 | 2.1 | 2.1 | 2.5 | 1.1 | 2.1 | 0.8 | 2.8 | 1.7 | 2.5 | 2.3 | 2.0 | 1.8 | 2.1 | ||
| 2014 | 1.2 | 4.2 | 2.1 | 1.3 | 1.1 | 1.1 | 2.1 | 2.9 | 1.0 | 1.3 | 1.8 | 1.3 | 2.2 | 1.5 | 2.1 | 1.3 | 1.7 | ||
| 2013 | 6.4 | 2.7 | 2.9 | 1.7 | 4.6 | 1.2 | 2.3 | 2.1 | 1.0 | 2.6 | 2.1 | 0.4 | 2.9 | 2.9 | 1.8 | 1.8 | 2.3 | ||
| 2012 | 1.2 | 3.1 | 2.0 | 2.9 | 5.5 | 2.2 | 3.5 | 3.4 | 2.4 | 0.6 | 4.8 | 4.8 | 3.2 | 3.3 | 3.0 | 2.1 | 3.0 | ||
| 2011 | 4.1 | 7.2 | 2.7 | 2.6 | 0.6 | 2.7 | 1.2 | 1.8 | 2.5 | 0.0 | 3.3 | 1.7 | 3.4 | 2.3 | 1.9 | 1.9 | 2.3 | ||
| 2010 | 6.2 | 3.5 | 4.9 | 2.7 | 2.4 | 3.3 | 5.8 | 2.4 | 0.8 | 2.1 | 2.0 | 0.4 | 2.3 | 3.3 | 4.1 | 1.5 | 2.9 | ||
| 2009 | 1.4 | 4.2 | 1.9 | 2.4 | 3.6 | 3.7 | 4.0 | 7.5 | 2.8 | 0.8 | 5.3 | 1.4 | 2.0 | 2.5 | 4.8 | 2.5 | 2.8 | ||
| 2008 | 0.0 | 6.1 | 1.5 | 1.4 | 2.7 | 0.9 | 8.7 | 6.5 | 1.6 | 1.2 | 5.4 | 0.9 | 1.9 | 1.6 | 4.4 | 2.1 | 2.3 | ||
| 2007 | 6.6 | 2.8 | 3.7 | 2.9 | 0.7 | 3.0 | 5.1 | 7.0 | 3.4 | 2.6 | 3.3 | 3.3 | 3.8 | 2.8 | 4.5 | 3.0 | 3.5 | ||
| 2006 | 2.6 | 1.9 | 3.5 | 2.8 | 1.2 | 0.6 | 1.1 | 5.2 | 4.4 | 3.2 | 5.1 | 2.3 | 2.3 | 2.7 | 2.0 | 4.2 | 2.9 | ||
| 2005 | 5.1 | 3.7 | 1.5 | 1.1 | 0.7 | 0.8 | 3.5 | 1.1 | 4.8 | 1.6 | 6.0 | 1.1 | 2.8 | 1.2 | 1.7 | 4.2 | 2.5 | ||
| 2004 | 2.8 | 2.0 | 1.0 | 0.6 | 1.2 | 0.9 | 1.2 | 1.0 | 3.1 | 2.7 | 1.0 | 0.6 | 1.9 | 0.9 | 1.0 | 2.5 | 1.6 | ||
| 2003 | 2.6 | 1.4 | 1.3 | 1.6 | 1.8 | 1.7 | 1.5 | 1.6 | 1.8 | 0.5 | 1.6 | 0.6 | 1.4 | 1.5 | 1.6 | 1.2 | 1.5 | ||
| 2002 | 0.0 | 2.5 | 0.5 | 0.9 | 0.5 | 0.9 | 1.9 | 3.3 | 0.9 | 0.0 | 1.2 | 1.1 | 1.0 | 0.6 | 1.7 | 0.6 | 1.0 | ||
| 2001 | 0.9 | 1.2 | 0.9 | 0.8 | 0.6 | 0.0 | 1.0 | 0.5 | 0.9 | 0.5 | 0.6 | 0.0 | 0.7 | 0.8 | 0.4 | 0.7 | 0.7 | ||
| 2000 | 0.8 | 1.3 | 0.5 | 1.3 | 1.9 | 0.3 | 0.4 | 1.0 | 3.7 | 0.0 | 0.0 | 0.0 | 0.6 | 1.2 | 0.5 | 1.5 | 1.0 | ||
| 1999 | 2.9 | 3.1 | 1.1 | 1.3 | 1.9 | 4.4 | 2.2 | 2.9 | 1.1 | 0.5 | 0.0 | 0.5 | 1.4 | 1.4 | 3.2 | 0.5 | 1.6 | ||
| 1998 | 0.0 | 1.9 | 3.3 | 3.3 | 1.8 | 2.8 | 1.5 | 1.9 | 0.0 | 2.6 | 0.0 | 0.0 | 0.6 | 2.7 | 2.2 | 0.6 | 1.8 | ||
| 1997 | 1.1 | 1.7 | 2.7 | 3.9 | 2.6 | 1.9 | 2.0 | 8.8 | 2.5 | 0.0 | 2.2 | 0.0 | 0.9 | 3.0 | 3.8 | 1.0 | 2.3 | ||
| 1996 | 4.5 | 1.1 | 4.0 | 6.1 | 3.7 | 3.0 | 1.9 | 5.9 | 6.9 | 1.6 | 0.0 | 2.3 | 2.4 | 4.7 | 3.5 | 3.6 | 3.6 | ||
| 1995 | 1.1 | 2.3 | 3.9 | 1.8 | 4.5 | 1.1 | 5.3 | 11.1 | 9.2 | 3.2 | 1.3 | 2.1 | 1.9 | 3.2 | 5.3 | 4.7 | 3.7 | ||
| 1994 | 2.0 | 7.8 | 7.4 | 5.8 | 2.2 | 4.3 | 1.5 | 5.2 | 2.3 | 4.6 | 3.8 | 2.2 | 4.1 | 4.5 | 3.5 | 3.7 | 4.0 | ||
| 1993 | 6.1 | 3.8 | 1.6 | 4.0 | 3.0 | 6.5 | 2.0 | 6.2 | 2.5 | 1.7 | 5.2 | 2.9 | 4.1 | 3.0 | 4.7 | 3.2 | 3.6 | ||
| 1992 | 0.0 | 0.0 | 3.5 | 6.4 | 5.6 | 4.8 | 1.7 | 12.2 | 0.0 | 3.4 | 1.3 | 1.7 | 0.6 | 5.2 | 5.6 | 1.5 | 3.3 | ||
| 1991 | 0.8 | 3.2 | 3.5 | 5.8 | 3.1 | 4.1 | 8.9 | 8.0 | 3.2 | 3.4 | 0.0 | 0.0 | 1.5 | 4.2 | 6.7 | 2.2 | 3.5 | ||
| 1990 | 3.9 | 5.9 | 2.2 | 4.1 | 7.5 | 6.9 | 5.6 | 5.6 | 3.4 | 3.6 | 1.4 | 6.6 | 5.3 | 4.7 | 6.0 | 2.9 | 4.8 | ||
| 1989 | 3.6 | 8.2 | 9.2 | 10.4 | 4.0 | 4.3 | 6.9 | 6.2 | 6.1 | 2.6 | 2.6 | 2.4 | 5.0 | 8.2 | 5.7 | 3.8 | 5.8 | ||
| 1988 | 5.2 | 7.1 | 5.6 | 6.2 | 6.2 | 4.1 | 5.5 | 11.4 | 6.4 | 5.3 | 4.0 | 2.4 | 5.1 | 6.1 | 6.9 | 5.3 | 5.8 | ||
| 1987 | 9.1 | 0.0 | 7.3 | 5.1 | 3.9 | 4.3 | 6.2 | 5.4 | 4.8 | 3.7 | 3.9 | 3.9 | 3.9 | 5.3 | 5.3 | 4.1 | 4.8 | ||
| 1986 | 3.8 | 7.9 | 5.7 | 0.0 | 8.5 | 2.9 | 17.4 | 8.3 | 9.7 | 5.9 | 0.0 | 11.4 | 8.1 | 5.1 | 8.6 | 5.4 | 6.6 | ||
| 1985 | 0.0 | 0.0 | 0.0 | 0.0 | 1.8 | 1.7 | 12.5 | 0.0 | 9.1 | 5.3 | 0.0 | 7.1 | 2.3 | 0.5 | 2.4 | 5.0 | 1.7 | ||
| 1984 | 0.0 | 0.0 | 0.0 | 0.0 | 0.0 | 0.0 | 0.0 | 0.0 | 0.0 | 0.0 | 3.2 | 0.0 | 0.0 | 0.0 | 0.0 | 1.1 | 0.4 | ||
| 1983 | 0.0 | 0.0 | 0.0 | 0.0 | 0.0 | 0.0 | 0.0 | 0.0 | 0.0 | - | 0.0 | 0.0 | 0.0 | 0.0 | 0.0 | 0.0 | 0.0 | ||
| 1982 | - | 0.0 | - | 0.0 | 0.0 | 0.0 | - | 0.0 | - | 7.7 | - | 0.0 | 0.0 | 0.0 | 0.0 | 7.7 | 1.4 | ||
Breeding data
Breeding records by month
Number of breeding records by breeding code and month, 2017 and all years| Breeding code | Jul | Aug | Sep | Oct | Nov | Dec | Jan | Feb | Mar | Apr | May | Jun |
|---|---|---|---|---|---|---|---|---|---|---|---|---|
| 2017 | ||||||||||||
| Breeding (BLA code) | 0 | 0 | 0 | 0 | 0 | 0 | 0 | 0 | 0 | 0 | 0 | 0 |
| Carrying Food | 0 | 0 | 0 | 0 | 0 | 0 | 0 | 0 | 0 | 0 | 0 | 0 |
| Copulating | 0 | 0 | 0 | 0 | 0 | 0 | 0 | 0 | 0 | 0 | 0 | 0 |
| Display | 0 | 0 | 1 | 0 | 0 | 0 | 0 | 0 | 0 | 0 | 0 | 0 |
| Dependent young | 0 | 0 | 0 | 0 | 0 | 0 | 1 | 0 | 0 | 0 | 0 | 0 |
| Faecal sac | 0 | 0 | 0 | 0 | 0 | 0 | 0 | 0 | 0 | 0 | 0 | 0 |
| Inspecting hollow | 0 | 0 | 0 | 0 | 0 | 0 | 0 | 0 | 0 | 0 | 0 | 0 |
| Nest building | 0 | 0 | 0 | 0 | 0 | 0 | 0 | 0 | 0 | 0 | 0 | 0 |
| Nest with eggs | 0 | 0 | 0 | 0 | 0 | 0 | 0 | 0 | 0 | 0 | 0 | 0 |
| Nest with young | 0 | 0 | 0 | 0 | 0 | 0 | 0 | 0 | 0 | 0 | 0 | 0 |
| On/leaving nest | 0 | 0 | 0 | 1 | 0 | 0 | 0 | 0 | 0 | 0 | 0 | 0 |
| All years | ||||||||||||
| Breeding (BLA code) | 0 | 0 | 0 | 0 | 0 | 0 | 0 | 0 | 0 | 0 | 0 | 0 |
| Carrying Food | 0 | 0 | 0 | 0 | 0 | 0 | 0 | 0 | 0 | 0 | 0 | 0 |
| Copulating | 0 | 0 | 0 | 0 | 0 | 0 | 0 | 0 | 0 | 0 | 0 | 0 |
| Display | 1 | 0 | 1 | 0 | 1 | 0 | 0 | 0 | 0 | 0 | 1 | 0 |
| Dependent young | 0 | 0 | 0 | 0 | 0 | 5 | 4 | 0 | 0 | 0 | 0 | 0 |
| Faecal sac | 0 | 0 | 0 | 0 | 0 | 0 | 0 | 0 | 0 | 0 | 0 | 0 |
| Inspecting hollow | 0 | 0 | 0 | 0 | 0 | 0 | 0 | 0 | 0 | 0 | 0 | 0 |
| Nest building | 0 | 1 | 0 | 1 | 0 | 0 | 0 | 0 | 0 | 0 | 0 | 0 |
| Nest with eggs | 1 | 0 | 1 | 1 | 2 | 0 | 0 | 0 | 0 | 0 | 0 | 0 |
| Nest with young | 0 | 0 | 0 | 1 | 5 | 4 | 2 | 1 | 0 | 0 | 0 | 0 |
| On/leaving nest | 0 | 0 | 5 | 19 | 4 | 2 | 0 | 0 | 0 | 0 | 0 | 0 |
Breeding records by year
Average number of breeding records per period by breeding code| Period | Breeding (BLA code) | Carrying Food | Copulating | Display | Dependent young | Faecal sac | Inspecting hollow | Nest building | Nest with eggs | Nest with young | On/leaving nest |
|---|---|---|---|---|---|---|---|---|---|---|---|
| All years | |||||||||||
| All | 0.0 | 0.0 | 0.0 | 0.1 | 0.2 | 0.0 | 0.0 | 0.1 | 0.1 | 0.4 | 0.8 |
| Previous years | |||||||||||
| All previous years | 0.0 | 0.0 | 0.0 | 0.1 | 0.2 | 0.0 | 0.0 | 0.1 | 0.1 | 0.4 | 0.8 |
| Previous 30 years | 0.0 | 0.0 | 0.0 | 0.1 | 0.3 | 0.0 | 0.0 | 0.1 | 0.2 | 0.4 | 1.0 |
| Previous 20 years | 0.0 | 0.0 | 0.0 | 0.1 | 0.3 | 0.0 | 0.0 | 0.0 | 0.0 | 0.3 | 1.2 |
| 10 year groups | |||||||||||
| [2007,2017) | 0.0 | 0.0 | 0.0 | 0.2 | 0.6 | 0.0 | 0.0 | 0.0 | 0.0 | 0.7 | 2.1 |
| [1997,2007) | 0.0 | 0.0 | 0.0 | 0.0 | 0.0 | 0.0 | 0.0 | 0.0 | 0.0 | 0.0 | 0.3 |
| [1987,1997) | 0.0 | 0.0 | 0.0 | 0.1 | 0.2 | 0.0 | 0.0 | 0.2 | 0.5 | 0.6 | 0.5 |
| 5 year groups | |||||||||||
| [2012,2017) | 0.0 | 0.0 | 0.0 | 0.2 | 0.6 | 0.0 | 0.0 | 0.0 | 0.0 | 0.8 | 2.6 |
| [2007,2012) | 0.0 | 0.0 | 0.0 | 0.2 | 0.6 | 0.0 | 0.0 | 0.0 | 0.0 | 0.6 | 1.6 |
| [2002,2007) | 0.0 | 0.0 | 0.0 | 0.0 | 0.0 | 0.0 | 0.0 | 0.0 | 0.0 | 0.0 | 0.4 |
| [1997,2002) | 0.0 | 0.0 | 0.0 | 0.0 | 0.0 | 0.0 | 0.0 | 0.0 | 0.0 | 0.0 | 0.2 |
| [1992,1997) | 0.0 | 0.0 | 0.0 | 0.0 | 0.0 | 0.0 | 0.0 | 0.2 | 0.0 | 0.2 | 1.0 |
| [1987,1992) | 0.0 | 0.0 | 0.0 | 0.2 | 0.4 | 0.0 | 0.0 | 0.2 | 1.0 | 1.0 | 0.0 |
| Year | |||||||||||
| 2017 | 0.0 | 0.0 | 0.0 | 1.0 | 1.0 | 0.0 | 0.0 | 0.0 | 0.0 | 0.0 | 1.0 |
| 2016 | 0.0 | 0.0 | 0.0 | 0.0 | 1.0 | 0.0 | 0.0 | 0.0 | 0.0 | 1.0 | 1.0 |
| 2015 | 0.0 | 0.0 | 0.0 | 0.0 | 0.0 | 0.0 | 0.0 | 0.0 | 0.0 | 1.0 | 5.0 |
| 2014 | 0.0 | 0.0 | 0.0 | 0.0 | 1.0 | 0.0 | 0.0 | 0.0 | 0.0 | 1.0 | 4.0 |
| 2013 | 0.0 | 0.0 | 0.0 | 1.0 | 1.0 | 0.0 | 0.0 | 0.0 | 0.0 | 0.0 | 1.0 |
| 2012 | 0.0 | 0.0 | 0.0 | 0.0 | 0.0 | 0.0 | 0.0 | 0.0 | 0.0 | 1.0 | 2.0 |
| 2011 | 0.0 | 0.0 | 0.0 | 0.0 | 1.0 | 0.0 | 0.0 | 0.0 | 0.0 | 1.0 | 2.0 |
| 2010 | 0.0 | 0.0 | 0.0 | 1.0 | 0.0 | 0.0 | 0.0 | 0.0 | 0.0 | 0.0 | 1.0 |
| 2009 | 0.0 | 0.0 | 0.0 | 0.0 | 1.0 | 0.0 | 0.0 | 0.0 | 0.0 | 1.0 | 3.0 |
| 2008 | 0.0 | 0.0 | 0.0 | 0.0 | 0.0 | 0.0 | 0.0 | 0.0 | 0.0 | 1.0 | 1.0 |
| 2007 | 0.0 | 0.0 | 0.0 | 0.0 | 1.0 | 0.0 | 0.0 | 0.0 | 0.0 | 0.0 | 1.0 |
| 2006 | 0.0 | 0.0 | 0.0 | 0.0 | 0.0 | 0.0 | 0.0 | 0.0 | 0.0 | 0.0 | 0.0 |
| 2005 | 0.0 | 0.0 | 0.0 | 0.0 | 0.0 | 0.0 | 0.0 | 0.0 | 0.0 | 0.0 | 1.0 |
| 2004 | 0.0 | 0.0 | 0.0 | 0.0 | 0.0 | 0.0 | 0.0 | 0.0 | 0.0 | 0.0 | 1.0 |
| 2003 | 0.0 | 0.0 | 0.0 | 0.0 | 0.0 | 0.0 | 0.0 | 0.0 | 0.0 | 0.0 | 0.0 |
| 2002 | 0.0 | 0.0 | 0.0 | 0.0 | 0.0 | 0.0 | 0.0 | 0.0 | 0.0 | 0.0 | 0.0 |
| 2001 | 0.0 | 0.0 | 0.0 | 0.0 | 0.0 | 0.0 | 0.0 | 0.0 | 0.0 | 0.0 | 0.0 |
| 2000 | 0.0 | 0.0 | 0.0 | 0.0 | 0.0 | 0.0 | 0.0 | 0.0 | 0.0 | 0.0 | 0.0 |
| 1999 | 0.0 | 0.0 | 0.0 | 0.0 | 0.0 | 0.0 | 0.0 | 0.0 | 0.0 | 0.0 | 0.0 |
| 1998 | 0.0 | 0.0 | 0.0 | 0.0 | 0.0 | 0.0 | 0.0 | 0.0 | 0.0 | 0.0 | 0.0 |
| 1997 | 0.0 | 0.0 | 0.0 | 0.0 | 0.0 | 0.0 | 0.0 | 0.0 | 0.0 | 0.0 | 1.0 |
| 1996 | 0.0 | 0.0 | 0.0 | 0.0 | 0.0 | 0.0 | 0.0 | 0.0 | 0.0 | 0.0 | 2.0 |
| 1995 | 0.0 | 0.0 | 0.0 | 0.0 | 0.0 | 0.0 | 0.0 | 0.0 | 0.0 | 0.0 | 0.0 |
| 1994 | 0.0 | 0.0 | 0.0 | 0.0 | 0.0 | 0.0 | 0.0 | 0.0 | 0.0 | 0.0 | 2.0 |
| 1993 | 0.0 | 0.0 | 0.0 | 0.0 | 0.0 | 0.0 | 0.0 | 0.0 | 0.0 | 0.0 | 0.0 |
| 1992 | 0.0 | 0.0 | 0.0 | 0.0 | 0.0 | 0.0 | 0.0 | 1.0 | 0.0 | 1.0 | 1.0 |
| 1991 | 0.0 | 0.0 | 0.0 | 0.0 | 0.0 | 0.0 | 0.0 | 0.0 | 0.0 | 1.0 | 0.0 |
| 1990 | 0.0 | 0.0 | 0.0 | 0.0 | 0.0 | 0.0 | 0.0 | 0.0 | 1.0 | 0.0 | 0.0 |
| 1989 | 0.0 | 0.0 | 0.0 | 1.0 | 2.0 | 0.0 | 0.0 | 1.0 | 2.0 | 2.0 | 0.0 |
| 1988 | 0.0 | 0.0 | 0.0 | 0.0 | 0.0 | 0.0 | 0.0 | 0.0 | 1.0 | 2.0 | 0.0 |
| 1987 | 0.0 | 0.0 | 0.0 | 0.0 | 0.0 | 0.0 | 0.0 | 0.0 | 1.0 | 0.0 | 0.0 |
| 1986 | 0.0 | 0.0 | 0.0 | 0.0 | 0.0 | 0.0 | 0.0 | 0.0 | 0.0 | 0.0 | 0.0 |
| 1985 | 0.0 | 0.0 | 0.0 | 0.0 | 0.0 | 0.0 | 0.0 | 0.0 | 0.0 | 0.0 | 0.0 |
| 1984 | 0.0 | 0.0 | 0.0 | 0.0 | 0.0 | 0.0 | 0.0 | 0.0 | 0.0 | 0.0 | 0.0 |
| 1983 | 0.0 | 0.0 | 0.0 | 0.0 | 0.0 | 0.0 | 0.0 | 0.0 | 0.0 | 0.0 | 0.0 |
| 1982 | 0.0 | 0.0 | 0.0 | 0.0 | 0.0 | 0.0 | 0.0 | 0.0 | 0.0 | 0.0 | 0.0 |
Distribution map
Distribution - 2017
This map shows the observed distribution of the Little Eagle for 2017.
The red circles are the grid cells where Little Eagle have been reported.
The transparency of the red circles indicate how many surveys sheets were submitted for that grid cell; the darker the red the more reliable the data. Of the 315 grid cells with reports, 83 had only one sheet; an example is grid number A9.
The size of the circle represents the reporting rate. The maximum reporting rate for Little Eagle was 100.0% (eg grid number A9) and the minimum was 0.1% (eg grid number J14). 
Distribution - all years
This map shows the observed distribution of the Little Eagle for all years.
The red circles are the grid cells where Little Eagle have been reported.
The transparency of the red circles indicate how many surveys sheets were submitted for that grid cell; the darker the red the more reliable the data. Of the 703 grid cells with reports, 55 had only one sheet; an example is grid number A12.
The size of the circle represents the reporting rate. The maximum reporting rate for Little Eagle was 100.0% (eg grid number X2) and the minimum was 0.1% (eg grid number J12). 
Breeding map
Breeding - 2017
This map shows the breeding distribution of the Little Eagle for 2017.
The red circles are the grid cells where breeding activity for Little Eagle have been reported.
The size of the circle represents the number of reports. 
Breeding - all years
This map shows the breeding distribution of the Little Eagle for all years.
The red circles are the grid cells where breeding activity for Little Eagle have been reported.
The size of the circle represents the number of reports. 